
Identify and Resolve End-User Experience Issues in a Unified Score
When users complain about service, engineers can find themselves overwhelmed by having to sift through a huge amount of performance metrics to deduce what users experienced and where the problem lies. It can be even more confusing when all indicators are green and the problem still persists. According to research conducted by Forrester, one third of user complaints remain unresolved for a month or are never resolved.The VIAVI Observer platform replaces endless KPIs with a single End-User Experience (EUE) score, significantly reducing troubleshooting times. This technology uses wire-level packet information, empowering engineers to validate and resolve user issues with a single unified score. It answers user experience questions clearly and concisely.
The EUE satisfies multiple IT needs from NetOps and Network Architects to Developers, NOC engineers, and executives by answering questions related to business and IT initiatives:
- Are customers satisfied with their experience?
- How has the new data center impacted customer and user experience?
- Did the new cloud deployment meet the intended objectives?
- Were application error fixes effective?
- Is everything working as expected?
- Are users being affected?
- How widespread and/or severe is the issue?
- Is there a potential security threat?
- What's next for classification and resolution?
- What is the root cause?
Quantifying the quality of user interactions with the network and critical services is an incredibly complex process. Traditionally, two approaches are adopted to assess experience:
- Single Dimension: Use one or a few performance metrics as an indicator of user experience
- Data Deluge: Leveraging hundreds of performance metrics across multiple columns and solutions for assessments
Single Dimension: The provider performs basic analysis based only on a few metrics, such as response time, delay, or application errors, to represent user experience. However, with today’s complex IT service issues, this is often ineffective and leads teams down dead-end roads of incorrect resolution.
Data Deluge: Alternatively, other network performance management solutions overwhelm IT teams with hundreds of KPIs. Too much data without correlation or analysis of impact on end users minimizes any potential value. Additionally, ultimately leaves IT teams frustrated and in need of figuring out which metrics affect users or services.
End-User Experience Score in Observer
The end-user experience score of Observer Apex differs from these two limited approaches by using adaptive machine learning - running hundreds of KPIs through multiple algorithms to create a single score across all TCP network conversations. With this method, algorithms learn application behavior in just a few packets, adjusting the score to reflect their unique behaviors. KPIs are analyzed and summarized in a single, easy-to-understand score with three key components: Overall Score: how users experience the service. Domain: Identification of the network, application, server, or client causing the issue. Reason: Simple explanation of the issue.EUE Score Breakdown
Scores range from 0 to 10 and use the following color scheme: Figure 1: Score chart based on colors
Scores can provide visibility of a single user or an overview of groups of users defined by sites, location, etc.
Failures become clearer, false positives disappear, and all the noise that frequently masks problems is eliminated. IT teams can save themselves a lot of troubleshooting hours by “following the red scores” as they move up, down, and laterally through site performance dashboards or with three-click resolution.
Here’s an example:
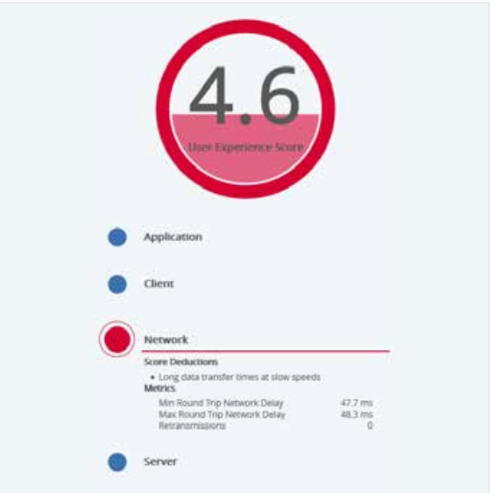 Figure 2: Score breakdown
As you can see above, in this case the situation is critical (Red) and the network is the problem of service degradation, the root cause being “Long data transfer times at low speed”. IT teams know exactly where to look and what is needed to fix the issue.
Scoring the Technical Details
Apex automatically analyzes and in real-time the delays between all packets involved in a network conversation. As each is captured and analyzed, it determines whether the delay has affected the end user and records the information. At the end of the conversation, Apex identifies the root cause of any degradation detected. It then scores the conversation based on the IP pair and application, presenting results as an end-user experience score.Every Packet Matters
End-user experience scores are as accurate as the underlying data they are calculated from. In other words, every lost packet has real implications for the ability to troubleshoot services. Observer guarantees precise visibility of every network conversation by capturing all packets. As the only NPMD solution validated by third-party analysts to capture, store, and analyze 40 Gb traffic flows at line speed without losing a single packet, you can be sure that Apex will never miss a problem.Final Business Value
What do all these technical details mean for IT teams? It's about VIAVI Solutions serving as a trusted partner so you can trust the results presented and achieve exceptional IT customer service. The VIAVI results-oriented approach provides the right amount of information in an easy-to-understand format. Billions of network conversations can be either rolled up into a couple of scores, or alternatively show the single questionable conversation and, if desired, the associated packets. All of this is achieved with just cable data and without complex agent instrumentation. VIAVI's end-user experience score greatly expands the number of IT staff who can leverage the power of wire data, including staff less familiar with network conversation behavior, such as level-1 support. By streamlining the network management processes of IT staff involved in monitoring and troubleshooting, teams can optimize and adjust resources before conditions change from good to unacceptable or critical.Observer Overview
Observer is a comprehensive solution that monitors and diagnoses network performance providing valuable information and assistance to network, operations, and security teams. As a central dashboard and reporting resource, Observer Apex serves as a launch point with pre-designed workflows for navigation in GigaFlow or GigaStor in real-time or historical service health viewing. Observer is ideal for meeting business objectives and overcoming challenges throughout the IT enterprise lifecycle.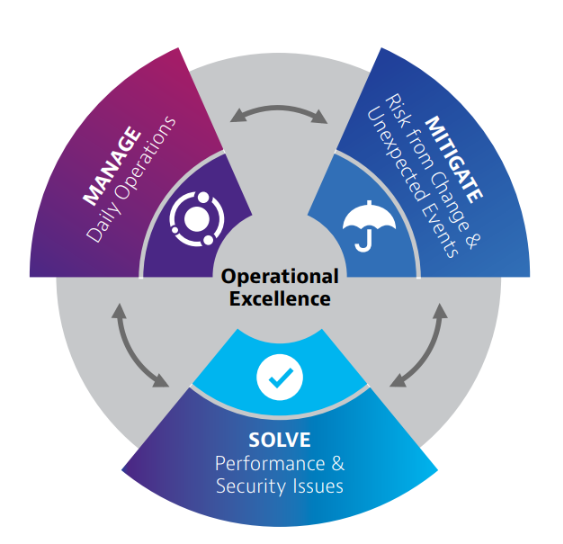 Figure 3: Operational Excellence